Monitoring
The monitoring is built around the kube-prometheus-stack. The standard monitoring stack in the Kubernetes space. It's based on the prometheus-operator, that manages Prometheus and Alertmanager and integrates them with the Kubernetes API, and Grafana, which is used to provide dashboards and visualisation.
Additionally it deploys Sloth, as SLO solution. It provides an SLO CRD to allow apps to define their own SLOs which can provide lazier alerting based on error budgets.
Grafana
Grafana is a platform for monitoring and observabiltiy. It's offered in form of a self-hostable install as well as a Cloud offering called "Grafana Cloud", which also includes some proprietary bits.
SSO
Grafana configuration for SSO using OIDC.
Using the Grafana Helm Chart (which is also part of the kube-prometheus-stack):
grafana.ini:
    users:
        default_theme: system
        default_language: detect
    auth:
        disable_login_form: true
        oauth_auto_login: true
        signout_redirect_url: https://keycloak.example.com/realms/my-realm/protocol/openid-connect/logout
    "auth.generic_oauth":
        name: OIDC-Auth
        enabled: true
        allow_sign_up: true
        client_id: $__file{/etc/secrets/auth_generic_oauth/client_id}
        client_secret: $__file{/etc/secrets/auth_generic_oauth/client_secret}
        auth_url: https://keycloak.example.com/realms/my-realm/protocol/openid-connect/auth
        token_url: https://keycloak.example.com/realms/my-realm/protocol/openid-connect/token
        api_url: https://keycloak.example.com/realms/my-realm/protocol/openid-connect/userinfo
        role_attribute_path: |
        contains(roles[*], 'admin') && 'Admin' || contains(roles[*], 'editor') && 'Editor' || 'Viewer'
        scopes: openid email profile roles
    feature_toggles:
        enable: accessTokenExpirationCheck
The various URLs can be found the well-known metadata of your OIDC provider for example: https://keycloak.example.com/realms/my-realm/.well-known/openid-configuration
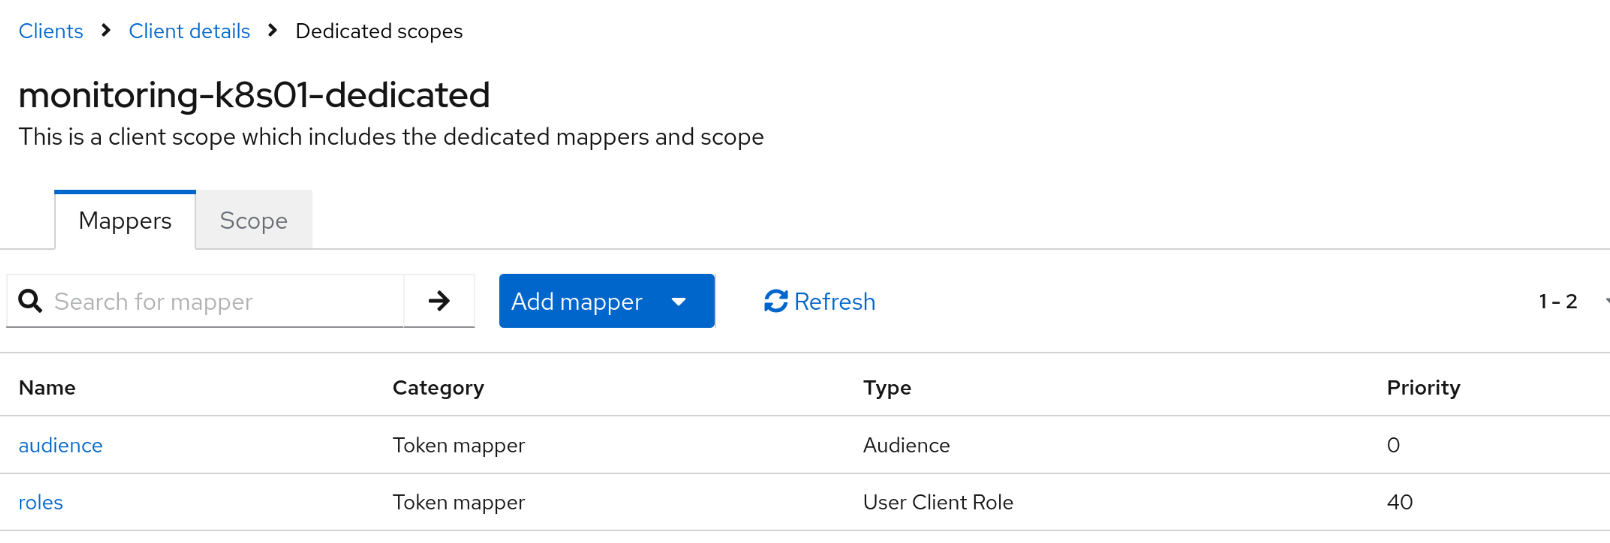
In Keycloak there are 2 defined client roles called admin and editor, which are mapped to the token attribute roles in the ID token, access token and userinfo.

The upstream documentation also provides some details on how to configure Grafana with Keycloak.