Monitoring
The Shivering-Isles Infrastrcture provides various services and tries to achieve a good Service Level. To validate the achievement of these service Levels, internal and external monitorings systems constantly check the status of the system and notify administrators if something goes wrong.
Since monitoring systems are supposed to notify about outages, it’s important that they continue to function during outages. While also keeping costs in check.
The overall setup
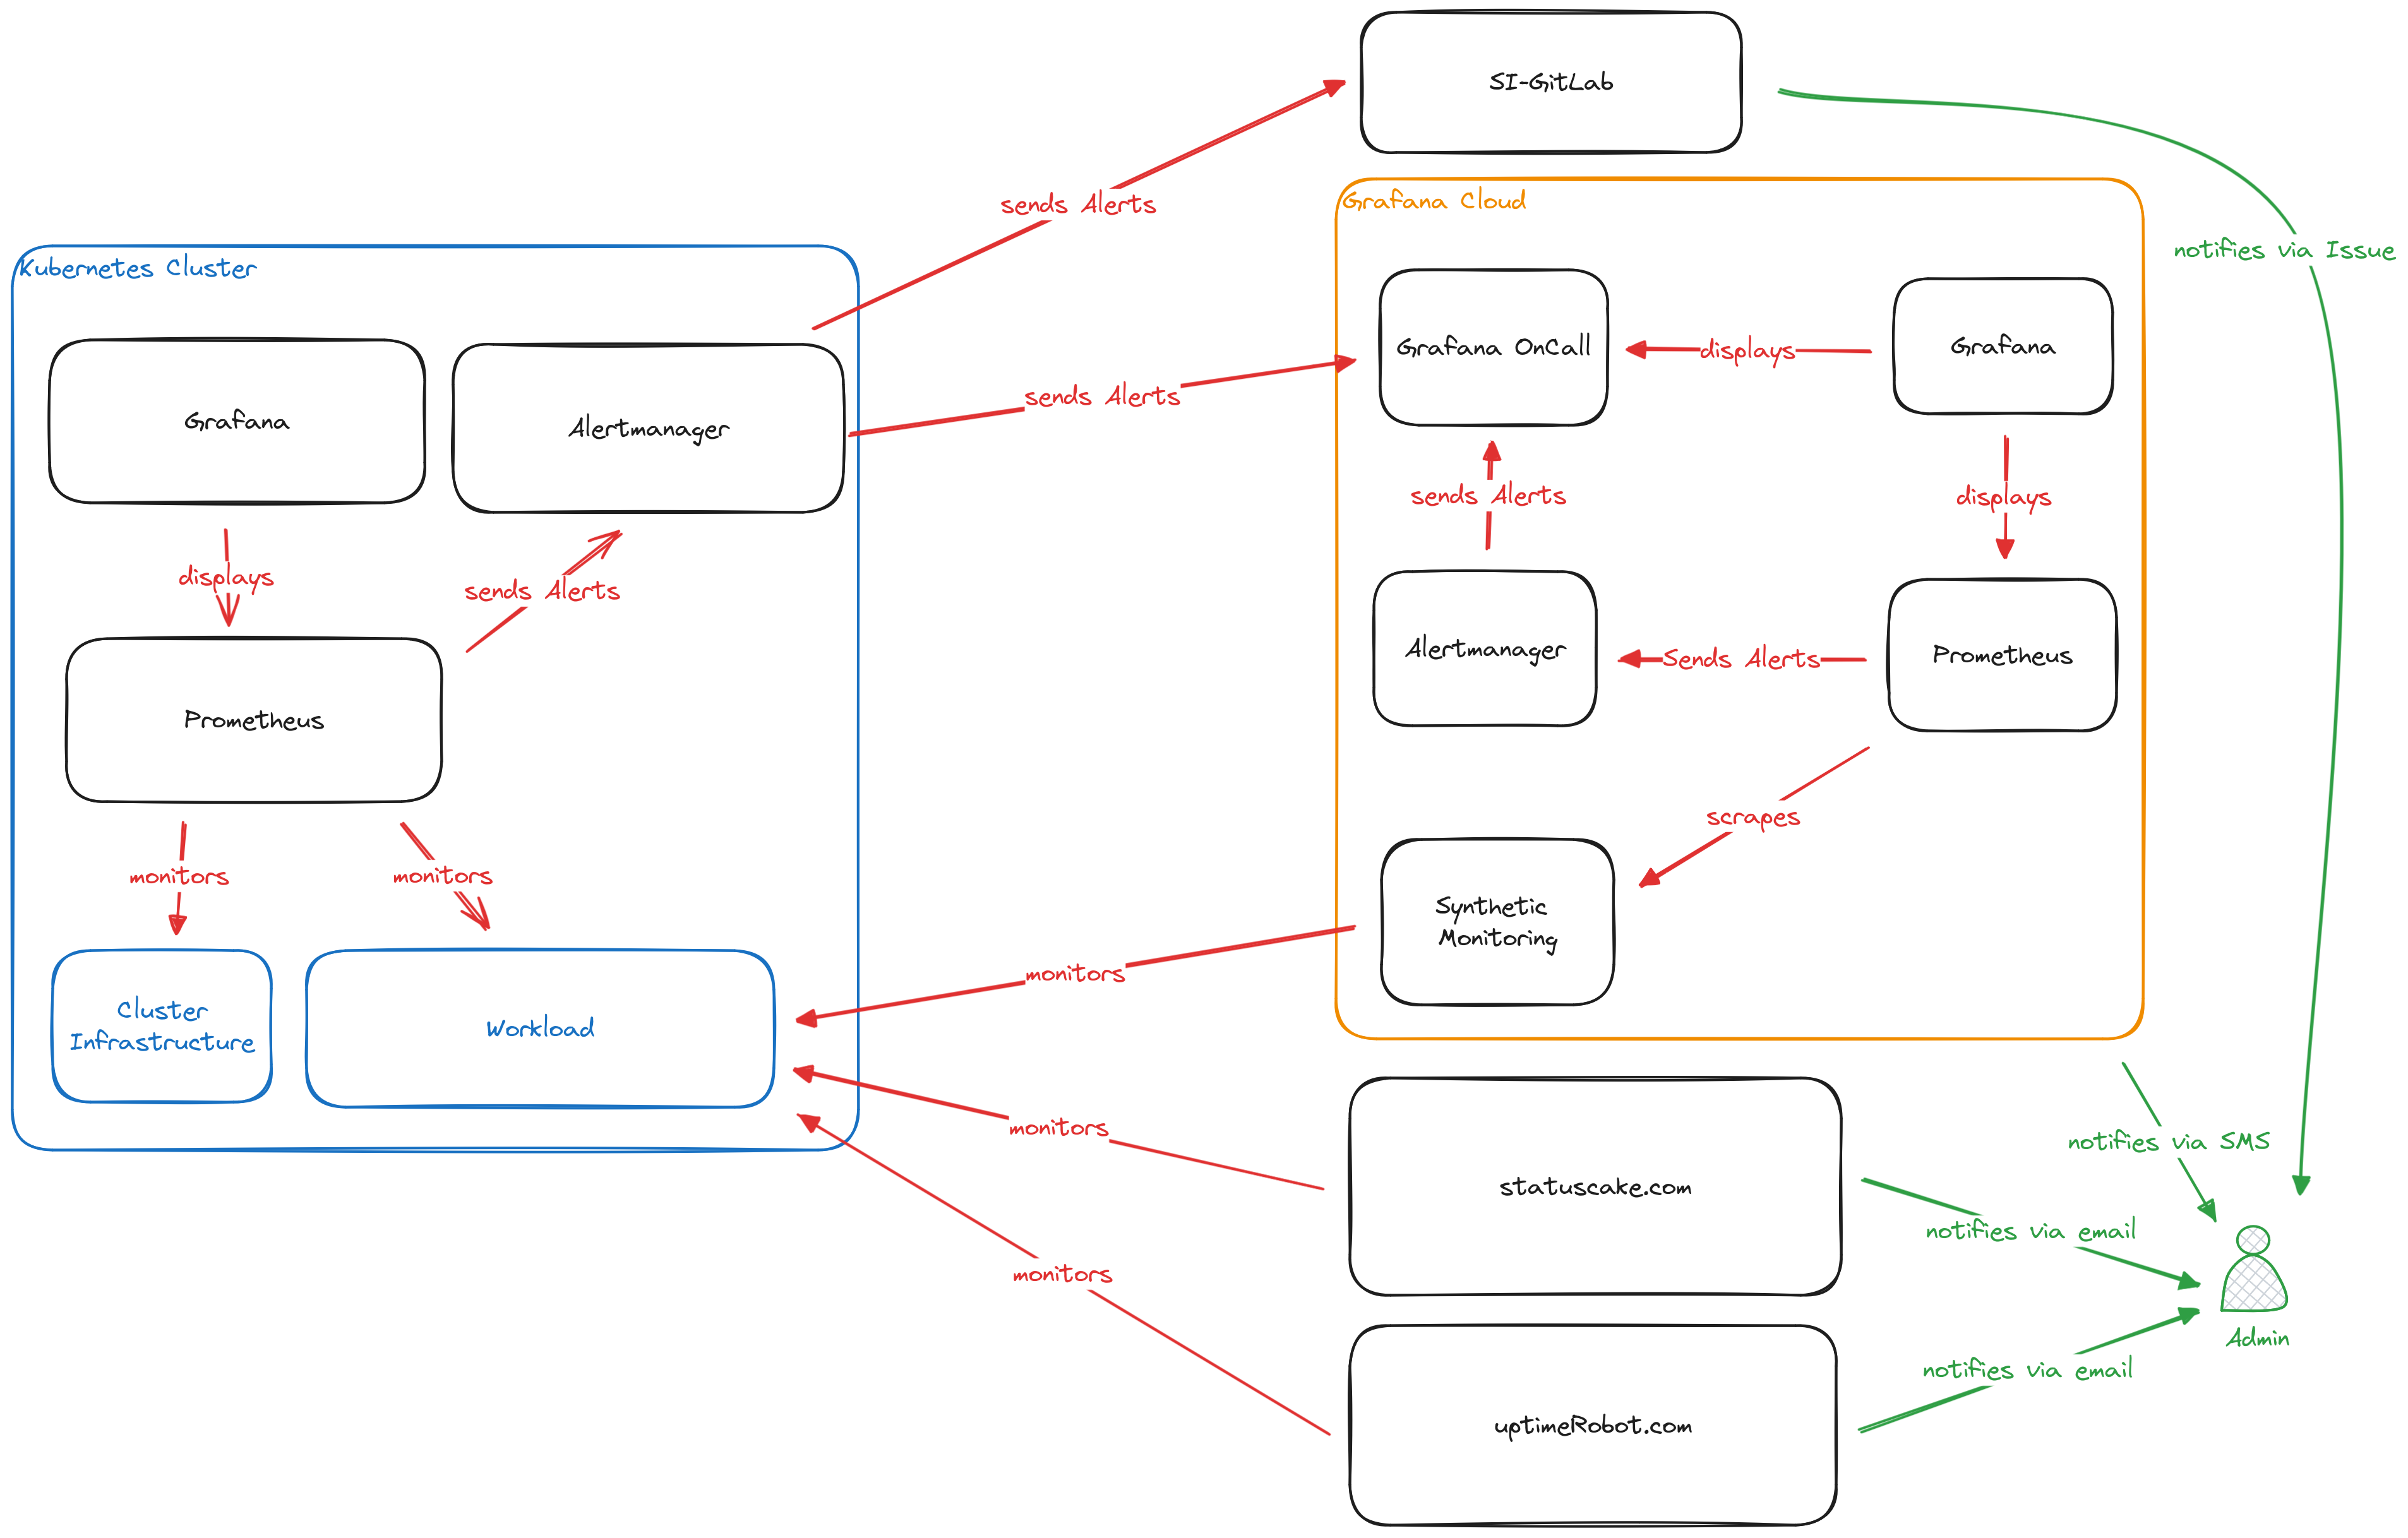
The Shivering-Isles infrastructure monitoring is split between internal and external monitoring.
For internal monitoring the kube-prometheus-stack is used and provides insights into all running applications and overall cluster health.
External monitoring uses a multituide of providers to regularly check the availabilty of externally available services such as the Shivering-Isles Blog or Microblog.
Internal Monitoring
The internal monitorings is defined using the prometheus-operator resources such as ServiceMonitors or PodMonitors in combination with PrometheusRules.
---
apiVersion: monitoring.coreos.com/v1
kind: ServiceMonitor
metadata:
  name: example
  namespace: example
spec:
  selector:
    matchLabels:
      app: example
  namespaceSelector:
    matchNames:
    - example
  endpoints:
  - port: metrics
---
apiVersion: monitoring.coreos.com/v1
kind: PodMonitor
metadata:
  name: example
  namespace: example
  labels:
    app.kubernetes.io/name: example
spec:
  selector:
    matchLabels:
      app.kubernetes.io/name: example
  podMetricsEndpoints:
    - port: metrics
---
apiVersion: monitoring.coreos.com/v1
kind: PrometheusRule
metadata:
  name: example
  namespace: example
spec:
  groups:
  - name: example
    rules:
    - alert: ExampleAlert
      annotations:
        description: Very examplish Alert that will trigger for some reason. Just ignore it, it's just an example.
        summary: Examplish Alert, please ignore.
      expr: absent(prometheus_sd_discovered_targets{config="serviceMonitor/example/example/0"})
      for: 10m
      labels:
        issue: Just ignore it, it's just an example.
        severity: info
To view metrics and details, an internal Grafana instance exists that provides Dashboards, that are directly created from configmaps along with the applications.
Finally there is an alert Manager that sends all critical alerts off to the external systems as well as keeping a hearthbeat with the external Alertmanager to make sure the cluster monitoring is still functional and the SI-GitLab to open issues for critical alerts, so they aren’t missed.
External Monitoring
The external Monitoring is setup across various external systems. Most importantly Grafana Cloud, but also StatusCake and UptimeRobot.
UptimeRobot, StatusCake and Synthetic Monitoring
UptimeRobot, StatusCake and Synthetic Monitoring are cloud service that allow to send Requests to public endpoints and measure the results from various locations in an interval. Providing external visibility for the infrastructure.
In the Shivering-Isles Infrastructure this monitoring allows to validate external connectivity indepentent of the internal monitorings. This is especially important since the Ingress Termination allows externally available services to be fully available, while being at home, while external connectivity is interrupted. This is not a theoretical scenario, it has taken place many times in the past.
UptimeRobot and StatusCake send their outage reports via E-Mail.
SI-GitLab
GitLab runs outside the home infrastructure on an external VPS. This makes it independent of the home infrastructure and just keeps track of issues send by the internal alertmanager.
Grafana Cloud Alertmanager and Prometheus
Besides Synthetic Monitoring, which is already discussed in a previous section, Grafana Cloud also provides internal Prometheus instances, which isn’t used for anything that the metrics of the Synthetic Monitoring. It is acompanied by an Alertmanager that is triggered by Prometheus alerts, when Synthetic Monitoring reports outages of websites and services.
Grafana OnCall
Grafana OnCall is the center for all critical alerts. It monitors the Grafana Cloud Alertmanager as well as the Alertmanager running in the Kubernetes cluster for hearthbeats. Further the Alertmanagers forward critical alerts to the OnCall instance which then triggers an escalation to notify an Admin via SMS and the Grafana OnCall app about outages.
This is particularly relevant, since the SI-Infrastructure also runs mailserver which can and do become unavailable. This prevents UptimeRobot and StatusCake from reporting outages.
SLOs and SLAs
Topics around SLOs and SLAs are described in the SRE-section
Runbooks
Part of the Monitoring is explaining alerts and provide helpful insights for a response. This is done in runbooks. For the Shivering-Isles Infrastructure runbooks are self-hosted.